By Cyril Noger, Anritsu EMEA
The many wireless technologies in use today inevitably lead to interferences, which disrupt services. Now, governments, regulatory bodies and mobile operators are focusing on identifying and minimising sources of interference, with some operators having dedicated staff to pin down illegal or unwanted signals – not a trivial process.
In a communication system, by definition an interferer is seen as a receiver problem. This doesn’t mean that nothing ever happens in the transmitter band, but these issues are normally dealt with by the operators when troubleshooting their infrastructure. The receiver band is more likely to be affected by external signals or increased noise levels which can desensitise receivers and make mobile phones undetectable by the base stations.
Offender characterisation
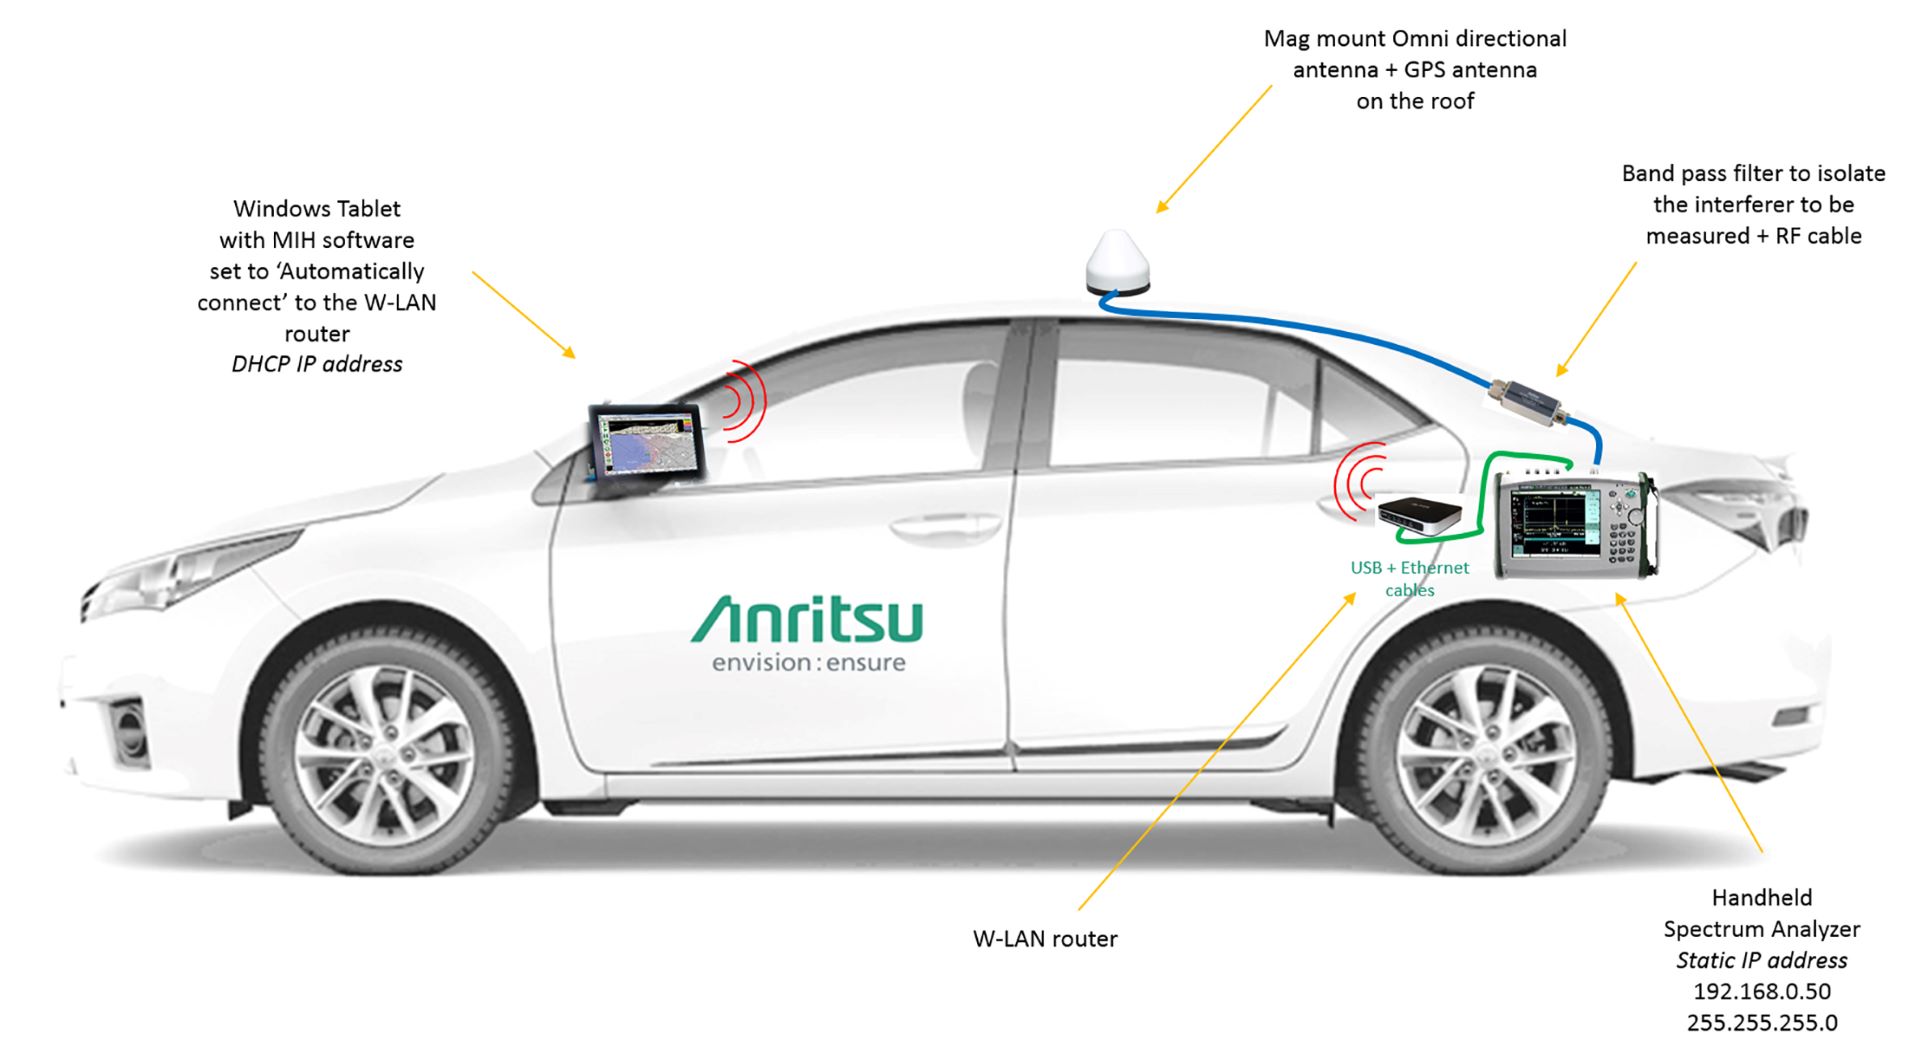
Once interference is observed, it is crucial to understand its nature. Normally, the signal is measured at ground level with an omnidirectional antenna. Its bandwidth, shape, frequency stability or drift, occurrence in time (over hours or days), behaviour (continuous or pulsed), modulation (or lack thereof), change in amplitude, and so on, are all measured and analysed with a spectrum analyser. The instrument’s “max hold” function sees the global bandwidth impacted by the interferer, with the “save on event” masks recording all the occasions when a pre-set amplitude “envelope” mask is exceeded – especially with an intermittent or random signal. Once this information is recorded, events can be analysed more closely, potentially determining the interferer’s origins. In this complex process, user knowledge and experience are more valuable than any autonomous software.
The channel power function that is used to quantify the signal’s amplitude needs to be set in the spectrum analyser. In situations where the interferer drifts in frequency, the channel power bandwidth must be wider than the signal’s bandwidth.
The spectrogram or “waterfall” display shown in Figure 1 is a very useful tool for recording all sweeps in the frequency band by colour-coding the amplitudes of the carriers present to provide information on periodicity or frequency drift, for example.