
By Oliver Rovini & Greg Tate, Spectrum Instrumentation
“When can a digitiser be used as an oscilloscope and what is the difference between an oscilloscope digitiser and a non-oscilloscope digitiser?”
These are interesting questions, and the best way to start to answer them is to look up the dictionary definition of an oscilloscope: “An electronic instrument used to measure changing electric voltages. It displays the waveforms of electric oscillations on a screen”. A digitiser along with appropriate software can do the same thing – it acquires an electrical voltage waveform and displays it on a screen.
The biggest difference is that an oscilloscope is generally a standalone instrument with a self-contained display, whereas a digitiser is a system component that acquires and stores an electrical voltage waveform and, with auxiliary software, displays that data on a screen. So, a digitiser can be used like an oscilloscope, which raises two further questions:
- Why would you use a digitiser in place of an oscilloscope?
- What digitiser characteristics make it a candidate for replacing an oscilloscope?
A Digitiser Instead of an Oscilloscope
One answer to the first question is that digitisers can support a greater number of input channels. Digitisers off er up to 16 channels for a single digitiser card, and some manufacturers’ products allow up to 16 cards to be linked together, for a total of 256 channels. This is a major advantage over oscilloscopes, which are generally limited to fewer than eight channels per instrument.
Digitisers also offer multiple channels in a smaller package. Compare an eightchannel digitiser with an eight-channel oscilloscope and you will readily see the difference. The digitiser card is so small that it can plug directly into a vacant PCIe slot in most modern PCs. Digitisers also offer a considerable advantage, with their much lower power consumption for the same number of channels.
The next consideration is vertical resolution. Oscilloscopes offer a maximum of 8-12 bits of resolution, whereas in fast digitisers this is 8-16 bits. Keep in mind that resolution is bandwidth-dependent, so the comparison works between instruments of the same bandwidth.
If you need to move data with high throughput to a PC for processing, then a digitiser is the best choice. For example, digitisers can stream data at up to 3.4GB/s over the PCIe bus, while standalone oscilloscopes normally use much slower interfaces like USB or LAN. This makes data from the digitiser available orders of magnitude faster than that from the oscilloscope. So, the digitiser is certainly the instrument of choice whenever customised signal processing and data analysis are required.

Another point for consideration is remote measurements. Network-based digitisers offer LXI control and data transfer, so the digitiser can be located a great distance from the measurement location. This is ideal if you need to view data and control an instrument from a lab, control room, office, or anywhere on your company’s LAN. The digitiser is also an expandable system component, since it is easy to increase the number of channels and change its configuration. Change or add cards and you can modify the available bandwidth, sampling rate and record length. In contrast, the oscilloscope is an instrument with a relatively fixed configuration; see Table 1 for comparisons.
A Digitiser Replacing an Oscilloscope
There are hundreds of digitiser models and configurations to choose from. Once you get past the basic questions of number of channels and the bandwidth, there are several more things to consider when selecting a digitiser to replace an oscilloscope.
The first is the sample rate: is it fixed or is there a selection of rates? Oscilloscopes offer selectable sample rates to view different frequency signals, and a digitiser replacing an oscilloscope should do the same. In general, the sample rate should be four to five times the bandwidth to accurately digitise waveforms with fast edges. Some digitisers offer a phase locked loop-based time-base that is programmable. Additionally, an external clock or external reference clock can be used to drive or synchronise the sampling rate with another source.
Acquisition memory determines the longest time record that can be acquired without reducing the sample rate. Digitisers can offer up to 4 giga-samples of memory as standard; that is about four times the maximum memory of a high-end oscilloscope.
In practice, this means the digitiser can record longer waveforms without having to lower the sampling rate, and therefore lose valuable time resolution.
Digitisers used as an oscilloscope also need a flexible front-end configuration. For example, digitisers can offer both 50Ohm and 1MOhm inputs at their buffered input and a 50Ohm high-frequency input path with very high signal integrity. Both input paths offer multiple input ranges just like an oscilloscope.
Oscilloscopes offer real-time and segmented acquisition modes. Sequential mode allows the acquisition memory to be segmented and, for applications where multiple events are to be acquired, it can reduce the acquisition dead time (the re-arm time between events). Digitisers generally offer a number of different acquisition modes. For example, ring buffer mode (similar to an oscilloscope’s real-time acquisition), FIFO or streaming mode, multiple recording (segmented mode), gated sampling and a multiple time base (ABA mode) that combines slow continuous recording with fast acquisition of trigger events. These multiple acquisition modes feature a fast re-arm time that can be as short as 80 sample periods (i.e. 16ns at 5GS/s). This is considerably shorter than the 1µs re-arm times of most oscilloscopes.
These different acquisition modes allow the user to configure the digitiser to best use its acquisition memory for different applications.
Triggering synchronises data acquisition with external events. Effective use of a digitiser requires great flexibility in device triggering. Simple edge triggers based on the slope and signal level are pretty standard on most digitisers; many offer window-triggering, as well.
Trigger sources include acquisition channels and multiple external trigger inputs.
For maximum trigger flexibility, these inputs, along with re-arm capability, can be combined logically to produce advanced trigger states.
One of the key advantages of digitisers is their ability to rapidly stream data to a computer for further analysis and archiving. Some digitisers, in FIFO mode (streaming mode), are designed for continuous data transfer between their buffer memory and PC memory. Utilising a PCI Express x8 Gen 2 interface, streaming speed is up to 3.4GB/s. Oscilloscopes, mostly using LXI or USB interfaces, are considerably slower in their ability to move data to a computer.
Combining the digitiser’s streaming capability with a fast data storage system (like a RAID-based disc drive unit) makes the digitiser perfect for applications where long seamless waveforms need to be stored. Systems can easily be configured to allow hours or even days of continuous recording.
Software for Handling Data from Modular Digitisers
Digitisers are ‘blind’ instruments, normally without an integral display to view, measure or analyse the data they collect. Instead, these functions are usually performed by a PC.
Software is, therefore, needed to control the digitiser and view the waveforms acquired. It should perform both simple and complex measurements and offer multiple analysis tools. It should also allow the user to confirm the digitiser’s operation during the development of their own custom software, and serve as an offline station for reviewing and analysing data.
Figure 1 shows the versatility of software in controlling, acquiring, viewing, measuring and analysing data with a digitiser, allowing it to be operated just like an oscilloscope. Here, two channels of data have been acquired and are shown in the lower-right grid. A horizontal expansion of that trace is shown in the lowercentre grid. The upper-left grid shows an X-Y plot of those two signals. The lower-left grid contains a digital display of the fourteen bits making up the signal on channel 1. The Fast Fourier transform (FFT) of the signal from channel 1 is shown in the upper-right display, while the upper-centre display shows the histogram of the same signal.
The software also provides cursors (two for each display grid) and measurement parameters. Cursors are shown on the FFT display where the amplitude and frequency of the spectral lines at 5 and 15MHz are measured. The cursor readouts appear in the Info pane to the left of the figure associated with the FFT display. Three of the 21 measurements are also shown in the Info pane associated with channel AI-Ch0. These are the peak-to-peak amplitude, effective (rms) amplitude and frequency. Analysis tools in the software include averaging, waveform arithmetic, FFT, histogram, filtering and conversion between analogue and digital domains.
Practical Measurement with a Digitiser as an Oscilloscope
In Figure 2, we show the phase voltages (Va, Vb and Bc), phase currents (Ia, Ib and Ic), and phase power dissipation (Pa, Pb and Pc) for a WYE-connected load (where we have access to both the phase and line voltages).
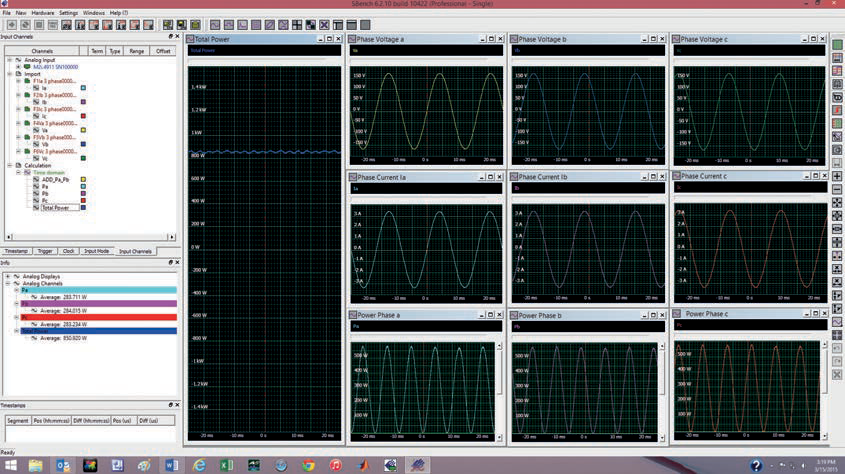
Multiply each phase voltage by its related phase current and the result is the instantaneous power in each phase. The mean value of the instantaneous power is the real power component. The sum of all three phase power readings is the total real power of the load.
This measurement is referred to as the three-wattmeter power measurement. If we were to make this measurement using external differential probes to measure the voltages, it would require six channels. With single-ended probes the number of channels increases to nine. The flexibility of being able to specify up to 16 channels in a single digitiser card is a major advantage in this type of measurement.
The phase voltages are shown in the top row of Figure 2. Phase currents appear in the centre row. The waveforms are multiplied together using analogue calculations, with the resultant phase power appearing in the bottom row. The sum of all three phase power waveforms, again an analogue summation, appears in the leftmost grid labelled “Total Power”. Note that the total power is relatively constant.
Real-time calculations, shown in the Info pane on the left, show the average values of the individual phase power waveforms along with the total power. The sum of the average values of the three phase-power measurements equals the average total power, in this case 850.9W.
Table 1: Comparing digitisers and oscilloscopes
| DIGITISER ADVANTAGES | OSCILLOSCOPE ADVANTAGES |
| Buy only what you need – from one to a large number of channels per system, expandable as needed | Higher overall bandwidth available (at a cost) |
| Higher vertical resolution available at a given bandwidth | Highly interactive viewing and control (touch screens, front panel controls) |
| Small, compact, low power instrument | Large number of compatible probes |
| High data throughput | Large number of built-in measurements and analysis techniques are available (at a cost) |
| Lower cost per channel | |
| Customisable measurements and analysis (user-programmable and third-party software) |
The Power of a Digitiser
These examples show the power in combining a digitiser with software to make measurements just like an oscilloscope. Keep in mind the key advantages offered by the digitiser and your next ‘oscilloscope’ purchase might actually turn out to be a digitiser:
- Larger maximum number of channels.
- Lower cost and power use per channel.
- Greater amplitude resolution at commensurate bandwidths.
- Higher data throughput for faster automated measurements.
- Smaller volume for equivalent number of channels.
- Easy remote control.
- Customised software and access to off-the-shelf analysis tools.
- Modularity and expandability.